
Ecommerce Analytics Tools – 8 Powerful Options Compared

Your sales are growing, marketing campaigns are performing well, and customers are coming in from multiple channels. On paper, everything looks good.
Then come the questions.
Which channels are actually driving profitable growth? Why are conversion rates slipping? Should you increase inventory?
Finding those answers isn’t always easy when the numbers live in Shopify, Meta, Google Analytics, email platforms, and spreadsheets.
That’s where the right ecommerce analytics tools can make a difference. In this guide, we’ll compare popular platforms, explain where each one fits, and help you build a reporting stack that grows with your business.
TL;DR – Top Ecommerce Analytics Tools
If you’re short on time, here are the 8 ecommerce analytics tools covered in this guide:
- Google Analytics 4
- Shopify Analytics
- Mixpanel
- Triple Whale
- Kissmetrics
- Adobe Analytics
- Looker
- Microsoft Power BI
For most ecommerce brands, the right combination of tools depends on your stage of growth and the questions you’re trying to answer. The sections below explain where each platform fits best.
Types of Ecommerce Analytics Tools
Ecommerce analytics tools generally fall into a few core categories. Each one answers a different set of questions about how the business is performing.
Here are the different types of analytic tools:
Web and Traffic Analytics
Web and traffic analytics tools help you understand what shoppers are doing on your site.
They answer questions like where visitors are coming from, which pages they spend time on, and where they leave before completing a purchase. This type of data helps you improve the customer experience and identify opportunities to increase conversions.
Marketing Attribution Platforms
Marketing attribution platforms focus on the sources of revenue.
If you’re running campaigns across multiple channels, these tools help connect sales back to the campaigns and touchpoints that influenced them. They can provide a clearer picture of marketing performance and help with decisions around ad spend and customer acquisition.
Financial and Revenue Reporting Tools
Financial and revenue reporting tools help answer a different set of questions.
Growing revenue is great, but you also need to understand margins, inventory costs, cash flow, and profitability. These tools help connect sales performance with the financial health of the business.
All three categories need to work in unison to give you a clear view of your business health and performance.

Key Metrics Ecommerce Analytics Tools Help Track
Using analytics tools, you can track hundreds of data points. In practice, most brands focus on just a handful of metrics that provide insight into customer behavior, marketing efficiency, and profitability.
Key metrics that you need to track include:
- Conversion Rate: This determines the percentage of website visitors who complete a purchase.
- Average Order Value (AOV): This shows the average amount customers spend each time they place an order.
- Customer Acquisition Cost (CAC): This represents the amount spent to acquire a new customer.
- Customer Lifetime Value (LTV): This estimates the total revenue a business can expect from a single customer over the course of their relationship.
- Return on Ad Spend (ROAS): This measures the revenue generated for every dollar spent on advertising.
- Cart Abandonment Rate: This represents the percentage of shoppers who add items to their carts but leave without completing the purchase.
- Returning Customer Rate: This metric measures the percentage of customers who make repeat purchases.
- Traffic Source Performance: This shows you which channels are bringing visitors and generating sales.
- Gross Profit Margin: This represents the percentage of revenue remaining after accounting for the cost of goods sold.
List of Best Ecommerce Analytics Tools for Your Business
The market is filled with analytics platforms, each with its own strengths. Some are built for traffic and conversion tracking, while others focus on attribution, reporting, or customer insights.
We’ve curated a list of 8 tools you can use for your business:
1. Google Analytics 4
Google Analytics 4 (GA4) is one of the most widely used analytics platforms and often serves as the starting point for an ecommerce analytics stack. It helps you understand how visitors arrive at the store, how they interact with pages, and what actions lead to conversions.
Best for: Brands of all sizes
Key strengths:
- Event-based tracking: See how visitors move through your store and what eventually leads to a purchase.
- Funnel analysis: Identify where shoppers leave during the buying process.
- Real-time reporting: See how campaigns and store activity are performing as they happen.
- Cross-platform measurement: Track customer interactions across websites and mobile apps.
2. Shopify Analytics
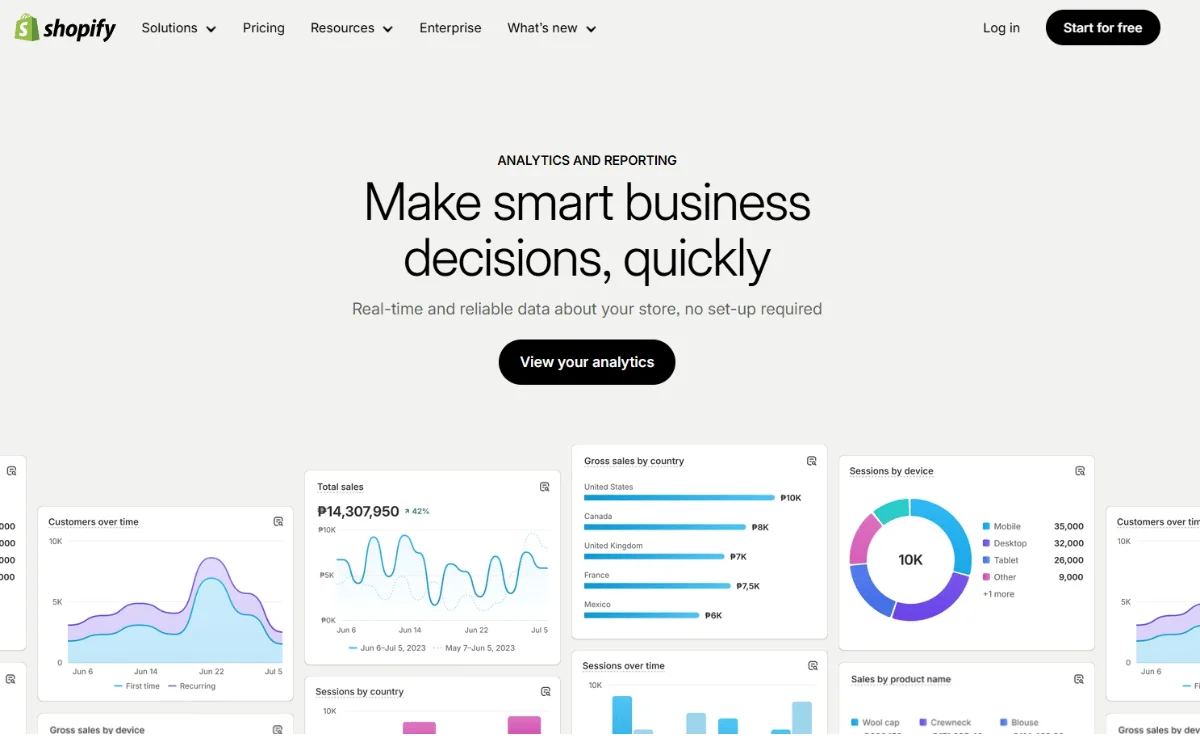
Shopify Analytics is built into the Shopify platform and helps merchants monitor sales, customers, and product performance through a set of ready-made reports.
For many brands, Shopify Analytics is the first place they look when reviewing store performance. As the business grows, custom reports and deeper analysis become available through higher-tier plans.
Best for: Shopify brands
Key strengths:
- Sales reporting: Keep an eye on your revenue, orders, and top-performing products.
- Customer insights: Understand how much customers spend and how often they come back.
- Channel comparisons: See which sales channels are contributing the most revenue.
- Custom reporting: Dig deeper into the numbers that matter most to your business.
3. Mixpanel
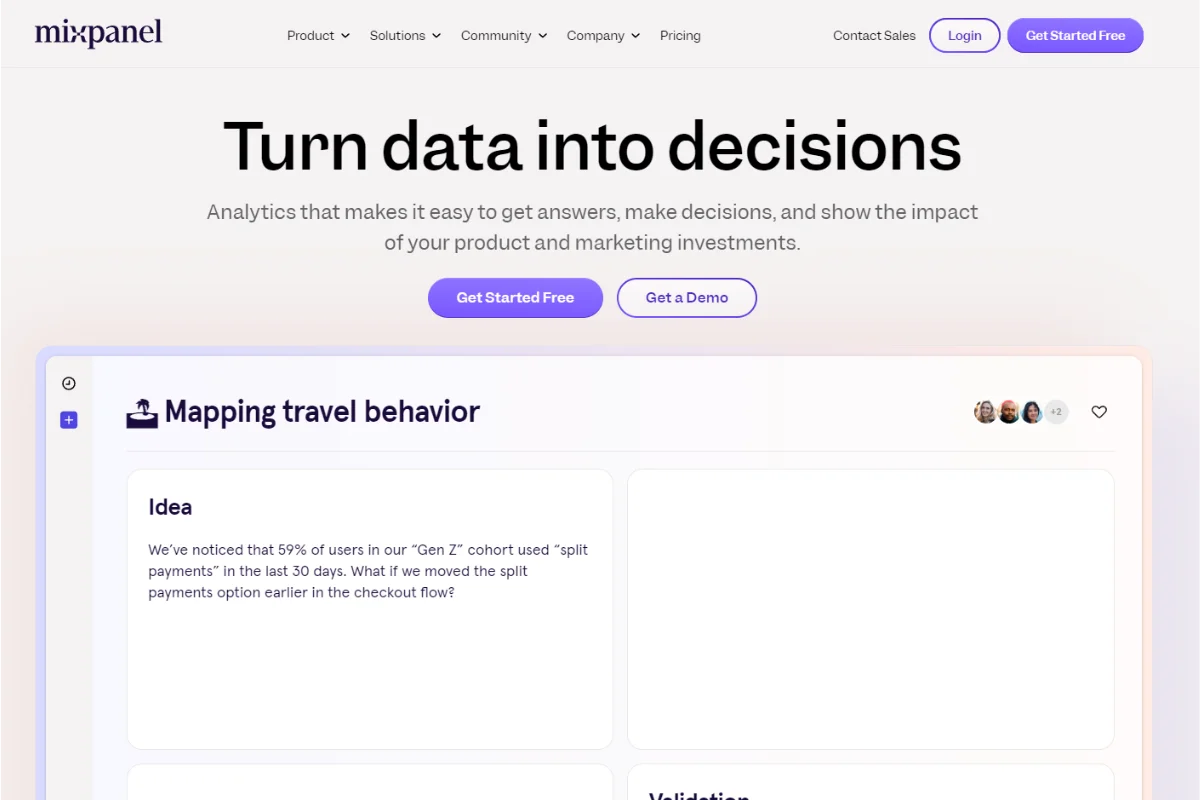
Mixpanel helps you understand how customers interact with your store over time. Instead of looking at visits alone, you can track user behavior across multiple sessions, making it easier to spot trends and better understand the customer journey.
This can be especially useful for brands looking to improve retention and create a better buying experience.
Best for: Advanced customer analytics
Key strengths:
- Funnel analysis: Identify where customers drop off.
- Customer segmentation: Group users based on shared behaviors.
- Cohort tracking: Measure retention across different customer groups.
- Custom reports: Explore trends over time.
4. Triple Whale
If you’re spending across Meta, Google, and other acquisition channels, keeping track of what’s actually driving revenue can get complicated. Triple Whale was built with ecommerce brands in mind and brings marketing and store data together in one place.
That makes it easier to understand how your ad spend is performing and which channels are contributing the most to growth.
Best for: DTC brands running paid advertising
Key strengths:
- Marketing attribution: Connect revenue back to campaigns and channels.
- ROAS tracking: Understand whether your ad spend is producing the desired results.
- Unified dashboards: Bring together data from Shopify and advertising platforms instead of switching between dashboards.
- Customer insights: Analyze purchasing patterns and lifetime value.
5. Kissmetrics
Kissmetrics’ approach is a little different. It helps you understand what happens after the first purchase. It gives you a closer look at customer behavior over time, making it easier to measure retention and repeat purchases.
For brands that mostly focus on lifetime value, having those insights can be just as important as acquisition metrics.
Best for: Customer journey analysis
Key strengths:
- Revenue reporting: Track sales and customer spending patterns.
- Cohort analysis: Compare different groups of customers to understand what sets your best buyers apart.
- Retention metrics: Measure repeat purchases and get a better picture of customer loyalty.
- Customer journey tracking: Follow behavior across multiple visits.
6. Adobe Analytics
Adobe Analytics is aimed at larger businesses that need more than standard reporting. It gives teams the flexibility to analyze large volumes of data and build reports around their specific needs.
Because of its depth, it is generally used by enterprises with dedicated analytics teams.
Best for: Enterprise ecommerce brands
Key strengths:
- Advanced segmentation: Analyze customers with greater precision.
- Attribution modeling: Understand how channels contribute to revenue.
- Predictive analytics: Identify trends and opportunities.
- AI-powered insights: Surface patterns from large datasets.
7. Looker
Looker is a business intelligence platform designed to bring your scattered information together, making it easier to analyze marketing, sales, and operational performance in one place.
Instead of jumping between separate reports, teams can build shared dashboards and work from the same set of numbers. That can be especially valuable for businesses that want better visibility across departments.
Best for: Centralized reporting
Key strengths:
- Interactive dashboards: Tailor dashboards to the way your business operates.
- Real-time reporting: Have access to recent performance metrics.
- Data modeling: Bring information from multiple platforms into one place.
- Collaboration tools: Share insights across teams.
8. Microsoft Power BI
Power BI is one of the most widely used business intelligence tools. It allows you to transform large amounts of data into dashboards and visual reports that are easier to understand.
Its flexibility makes it popular among growing businesses and enterprise teams alike.
Best for: Business intelligence and reporting
Key strengths:
- Dashboard creation: Build reports around key metrics.
- Data visualization: Present trends in an easy-to-read format.
- Multiple integrations: Connect information from different platforms.
- Advanced analytics: Explore business performance in greater detail.
The Right Ecommerce Analytics Tools for Your Stage of Growth
The right analytics setup depends on where your business is today. Here is a simple way to think about it:
Early-Stage Ecommerce Brands
If you’re still building your brand, keeping things simple usually makes the most sense.
If your business is at this stage, you’re probably focused on understanding where your traffic is coming from, which products are selling, and how effectively your store converts visitors into customers. Built-in reports and web analytics tools are often enough to answer those questions.
Adding four or five platforms too early can create more confusion than clarity. In many cases, the challenge isn’t a lack of data. It’s knowing which numbers actually matter.
Growing Ecommerce Brands
As your business grows, so do your marketing costs. Revenue is still important, but it becomes equally important to understand where customers are coming from, which campaigns are producing results, and how retention is affecting long-term growth.
This is where attribution and customer analytics tools start becoming more valuable for the business. If you’re pulling in numbers from Shopify, Meta, Google, and email platforms every week, then you need a more connected reporting setup to save time and gain clearer answers.
Scaling and Multi-Channel Brands
For larger ecommerce and DTC brands, analytics needs to connect more than traffic and sales.
At this point, you’re trying to understand how marketing spend, inventory, and customer behavior affect profitability. Revenue still matters, but so do margins, ecommerce cash flow, and long-term customer value.
This is where business intelligence tools, custom dashboards, and financial reporting become more important. The goal is to bring marketing, sales, operations, and finance data together so decisions are based on the full picture.
How to Turn Ecommerce Data Into Better Decisions
After collecting the data, you need to put it to better use by making smarter decisions across marketing, inventory, and profitability.
Here’s how you can turn data into better decisions:
- Optimize marketing spend: Use channel performance and acquisition data to identify which campaigns are driving profitable growth and where budgets should be reallocated.
- Plan inventory with greater confidence: Trends in sales and customer demand can help you forecast inventory needs and avoid tying up cash in slow-moving products.
- Improve pricing and margins: Looking beyond revenue can reveal which products, channels, and customer segments contribute the most to profitability.
- Strengthen customer retention: Metrics such as repeat purchase rate and customer lifetime value can help you identify opportunities to increase long-term customer value.
- Forecast future growth: Historical trends and performance data can provide a stronger foundation for setting sales targets, planning cash flow, and making investment decisions.
If you’re struggling to turn data into better decisions, CFO Expertise can help.
We work exclusively with ecommerce brands to help them look beyond reporting and provide strategic financial guidance. Our team can help connect marketing, operational, and financial data through custom KPI dashboards, accrual-based reporting, cash flow forecasting, and fractional CFO support tailored to ecommerce.
Need help connecting the numbers behind your business? Book a consultation with us.

Frequently Asked Questions (FAQs)
Below are answers to some of the most common questions about ecommerce analytics tools:
What is the Difference Between Ecommerce Analytics Tools and General Web Analytics Tools?
General web analytics tools focus on website traffic and user behavior. Ecommerce analytics tools go further by tracking metrics such as sales, average order value, customer lifetime value, and channel performance.
They are designed to help you understand how traffic translates into revenue and profitability.
Are Free Ecommerce Analytics Tools Worth Using?
Yes. Many brands start with free tools and get plenty of value from them.
Platforms like Google Analytics 4 and Shopify Analytics offer free built-in reporting that can provide useful insights into traffic, conversions, and sales performance.
Which Ecommerce Analytics Tools Work Best with Shopify and Amazon?
The answer depends on what you want to measure. Shopify Analytics and Google Analytics 4 provide a strong foundation for most brands.
As operations become more complex, tools such as Triple Whale, Looker, and Power BI can help bring together data from multiple channels and platforms.
How Many Ecommerce Analytics Tools Does a Brand Need?
There is no fixed number. Most brands do not benefit from having as many tools as possible. The right setup depends on the size and complexity of the business.
Many growing brands start with two or three core tools and expand their stack only when new reporting needs arise. The primary goal is to gain financial clarity.
When Should an Ecommerce Brand Outsource Analytics Instead of Using a Tool?
While analytics tools are good for collecting and organizing data, they do not provide strategic guidance. If you’re spending more time pulling reports than making decisions, it may be time to bring in outside expertise.
Many e-commerce brands turn to fractional CFOs once they need help connecting marketing performance, inventory, cash flow, and profitability.
Conclusion
The best ecommerce analytics tools help you see what’s happening inside the business. Choosing the right tools depends on your stage of growth and the questions you’re trying to answer.
Eventually, the conversation shifts from reporting to strategy. Understanding how marketing performance connects to inventory, cash flow, and profitability enables brands to scale with confidence.
At CFO Expertise, we help Shopify, Amazon, and DTC brands with everything from accurate monthly reporting and inventory planning to forecasting and hands-on fractional CFO support. The goal is to help founders gain more clarity and make decisions with confidence.
If you’re ready to turn better reporting into better decisions, schedule a consultation with our team.